
Appearance
AdminCycle reports — rosters & aggregates
The Report Builder now builds three kinds of report. Alongside the original Analytics reports (a single data source rendered as a table and charts), you can now build cycle reports that anchor to one program and one cycle:
- Cycle roster — one row per member enrollment in the cycle, with the columns you choose (member fields, enrollment fields, per-step status/dates, and completion-rule outputs).
- Aggregate summary — a cross-member distribution of a form's answers across the cycle (how many chose each option, as counts and percentages).
These reproduce the operational "who's where in the cycle" views and the survey-style roll-ups that previously had to be exported and built by hand.
Open Reporting → Report Builder. The list shows every saved report with its Type (Analytics, Cycle roster, or Aggregate summary), who created it, and when it was last modified.
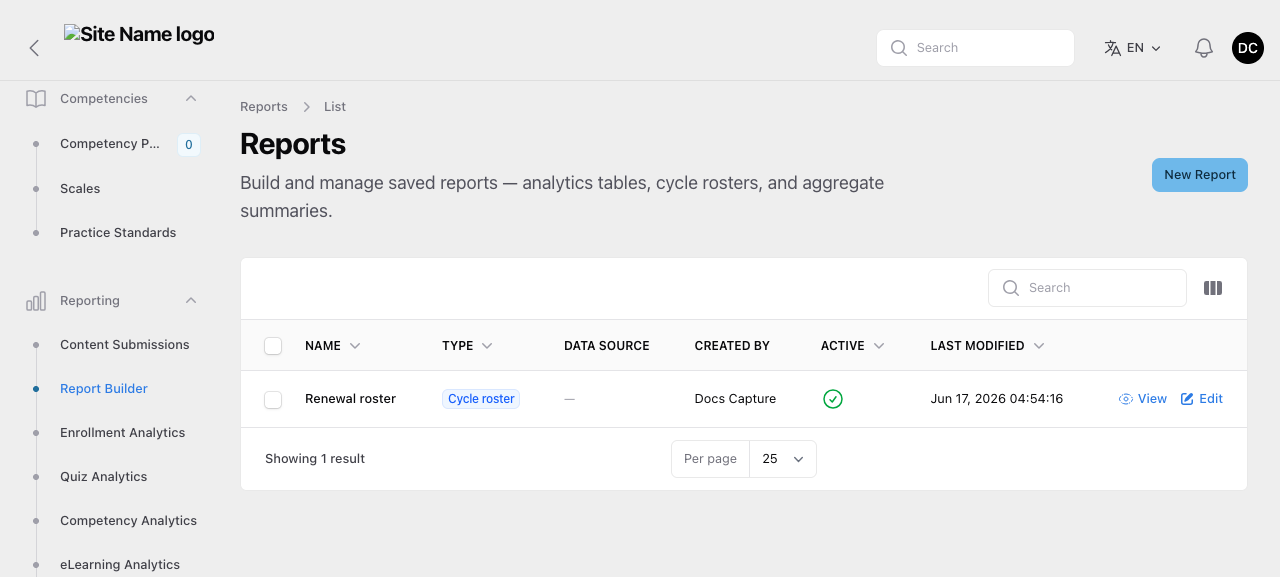 The Report Builder list. The Type column distinguishes Analytics, Cycle roster, and Aggregate summary reports; Data Source applies only to Analytics reports.
Choosing a report type
Click New Report, give it a name, then pick a Report Type. The rest of the form changes to match:
- Analytics keeps the classic flow — pick a Data Source and choose columns.
- Cycle roster and Aggregate summary ask you to anchor the report to a Program and Cycle instead of a data source.
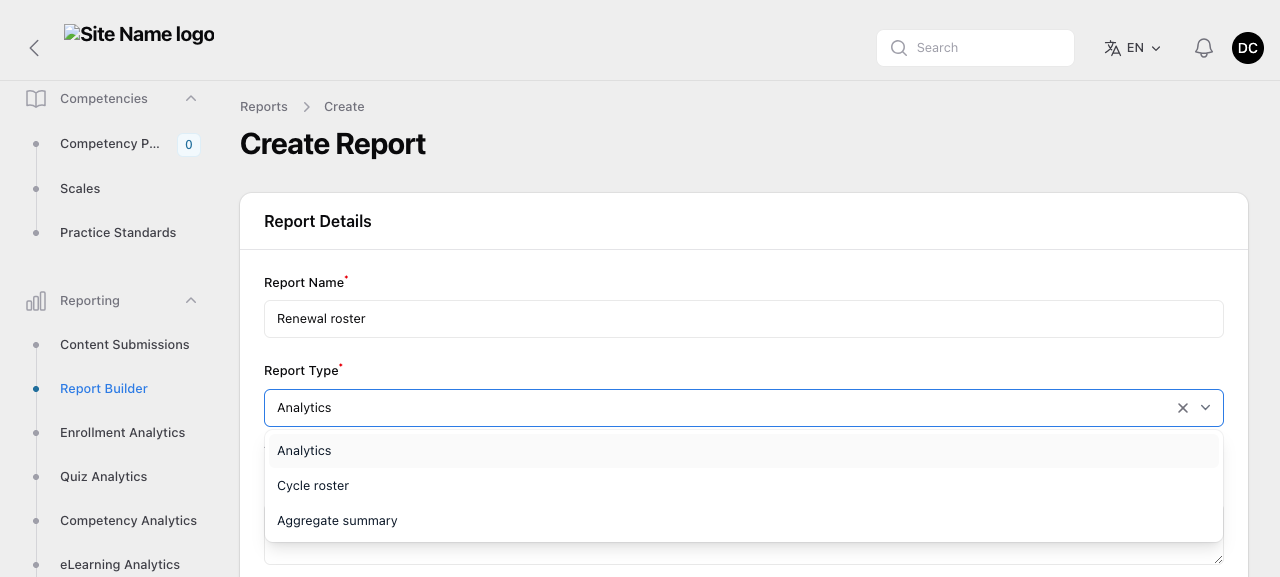 Pick a Report Type. Cycle roster and Aggregate summary anchor to a program and cycle instead of a data source.
Building a cycle roster
- Set Report Type to Cycle roster.
- Choose the Program, then the Cycle. Selecting the cycle loads the columns available for that program and cycle.
- In the Columns section, decide what the report shows (see below).
- Save. The report appears in the list, ready to view and export.
Reusing a report for another cycle
You rarely need to build the same roster twice. On the report list, each row has a Duplicate Report action next to Edit. It opens Rename Report with the name pre-filled as Copy of … — already numbered if a copy by that name exists — and creates a copy you can then point at a different program or cycle in Edit.
The copy keeps the original's columns, filters, program and cycle, and its access roles. It is not pinned to navigation, so a half-finished copy won't show up for everyone.
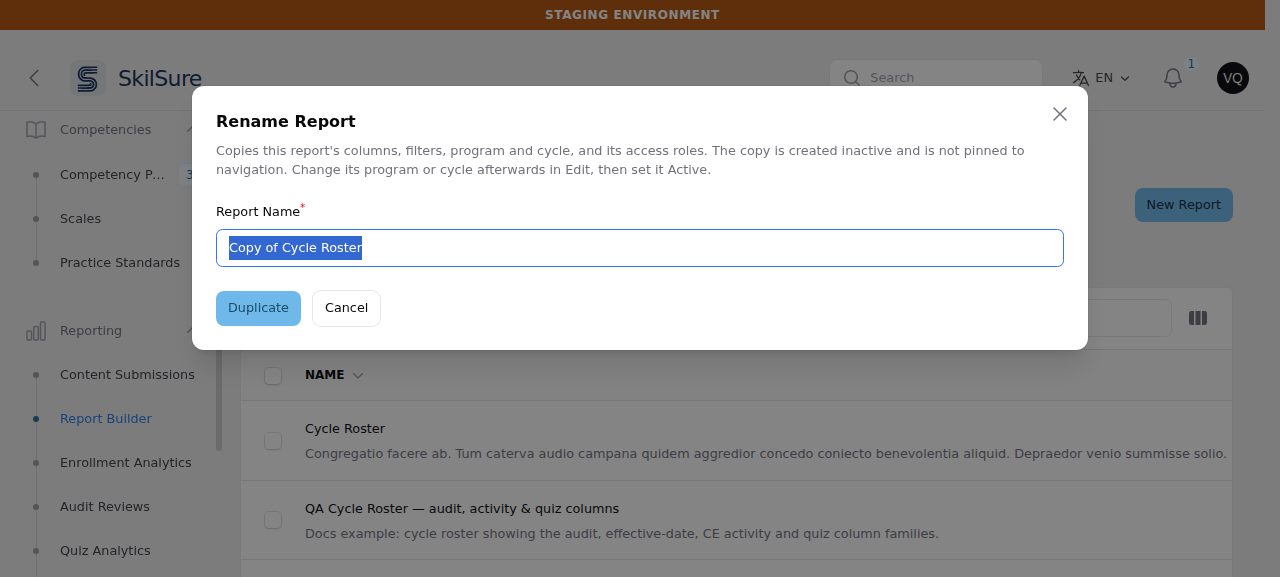 Duplicating a report. The name is pre-filled, and the dialog says what the copy does and doesn't carry over.
A copy keeps the email schedule — and may cover different members
If the report you duplicate has a scheduled email, the copy inherits the schedule and the recipients. The copy is created inactive, so nothing is sent until you set it Active — do that only after you have checked both.
Check them, because the copy belongs to you, and a scheduled export covers the members its owner can see. If the person who built the original could only see part of your organisation and you can see all of it, the copy will report on more people than the original did, while still emailing the original recipient list — which may include addresses outside your organisation.
Duplicate Report is controlled by its own permission, separate from the one for creating reports. If an admin cannot see the action, grant their role the report replicate permission.
Configuring columns
The Columns section lists every column discovered for the cycle, grouped across member fields, enrollment fields, each required step's status/date, and any Learning Portfolio completion-rule outputs. For each column you can:
- Include it in the report (toggle off the ones you don't need).
- Mark an included column Default visible — visible columns show immediately; the rest stay available behind the report's column picker when viewing.
- Reorder columns by dragging, so the report reads in the order your team expects.
- Rename the header — the Column header field is editable, so a discovered column like "Member Name" can be shown as "Full Name" (or whatever your audience expects). The header you set is used on screen and in the CSV export.
Columns are discovered from the cycle — you can include, hide, reorder, and rename them, but you can't invent a column that isn't in the cycle.
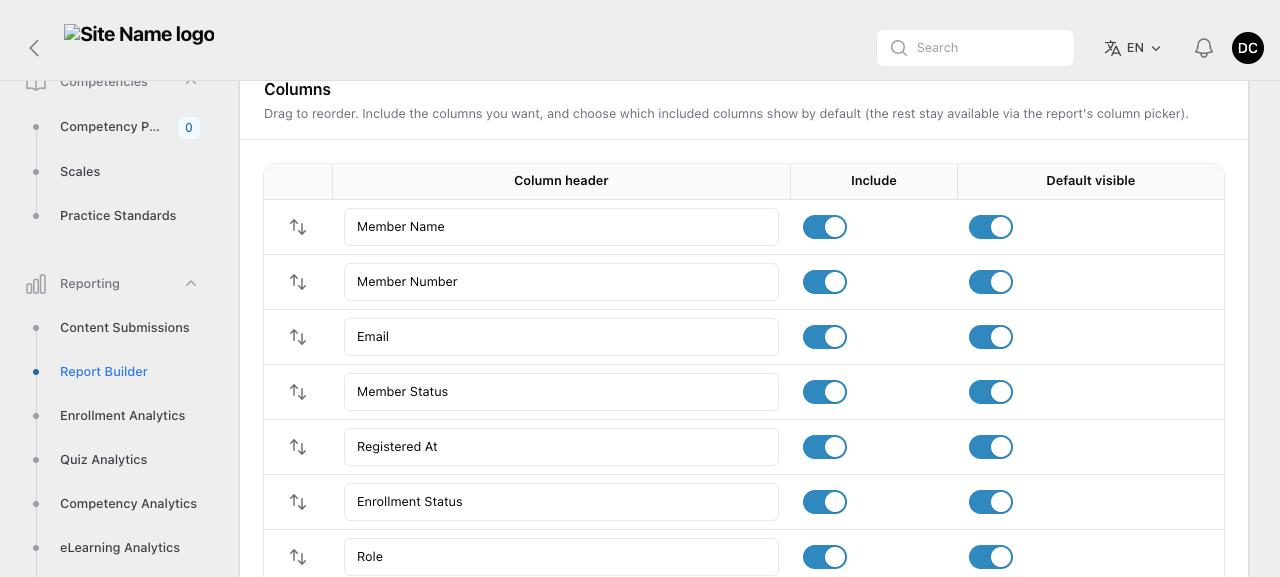 Columns are discovered from the cycle. Edit the header text, toggle Include and Default visible, and drag to reorder.
Enrollment columns
A cycle roster can include enrollment-level columns — enrollment status, enrollment date, completion date, role, program, and cycle — alongside member fields and per-step status. Each enrollment is one row, even where a step has been re-attempted.
Removed members
By default a roster shows only current members. If someone has been deleted from your tenant, their enrollment row is left out of the report and the CSV export.
Turn on Include deleted members in the Columns section when a report is used for historical accounting and needs to keep people who have since been removed — an end-of-cycle compliance record, for example, where dropping a member would change last year's totals.
This changes existing reports
Rosters used to include removed members silently, with no way to tell them apart from current ones. They are now excluded unless you opt in. If a report's row count drops after this change and you need the old behaviour, turn Include deleted members on for that report.
Which time zone dates are shown in
Columns that carry a time — Completion Date, Enrollment Date, Registered At, and each step's Status Date — are shown in your tenant's time zone, the one set in Settings, both on screen and in the CSV export. They deliberately do not follow the individual administrator's personal time zone, so two administrators looking at the same report always read the same date.
Columns that are a calendar day only — the Effective and Override dates below, and a step's Due Date — are not converted at all. A date is the same day whoever reads it.
This matters most around midnight: a step completed late on December 31 in your time zone is stored internally as January 1 UTC, and before this was corrected it could be reported as the wrong day — and in that example, the wrong year.
Effective dates vs. overrides
There are two sets of date columns, and they mean different things:
- Effective Start Date, Effective Deadline Date, Effective Grace Period, Effective Extension Date — what the date actually resolves to for that user: their own override when one is set, otherwise the cycle's date. These are usually the ones you want.
- Start Date Override, Deadline Date Override, Grace Period Override, Extension Date Override — only the per-user override. Blank for everyone who doesn't have one, which on many cycles is most of the roster.
Audit, activity, and quiz columns
Beyond member, enrollment, and step columns, a cycle roster discovers three further groups when the cycle has the underlying data.
Audit columns appear on any cycle where at least one member has been assigned for audit. They report that member's current audit assignment and the most recent submitted review: whether they're Selected for Audit, the Auditor Name, the Context State, the Review Final Status, the review and member submit dates, Review Count, and the auditor's Final Comment.
Who can see audit columns
Audit columns — including the auditor's Final Comment — are only shown to admins who hold the audit-history permission. Everyone else sees the report without them, on screen and in the CSV. Because scheduled deliveries are sent to whatever addresses the report names, and those recipients are not checked against roles, take care before adding Final Comment to a scheduled report.
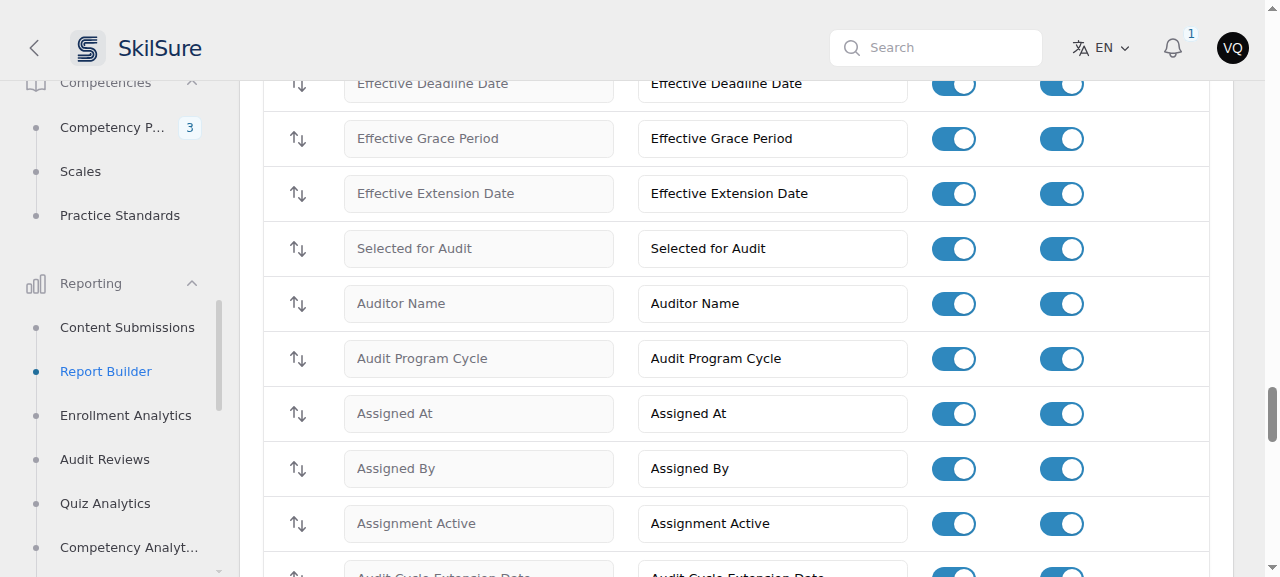 The Columns section on a cycle that has audit assignments — the effective-date columns run straight into the audit family, each editable and toggleable like any other column.
Two details worth knowing:
- Selected for Audit means currently selected — an active assignment that hasn't been withdrawn. A member whose assignment was revoked reads No, but the auditor is still named and Assignment Active shows No, so you can still see who audited them.
- Audit columns are calculated per member, so they can't be sorted or filtered. Use search and the other columns to narrow the roster first.
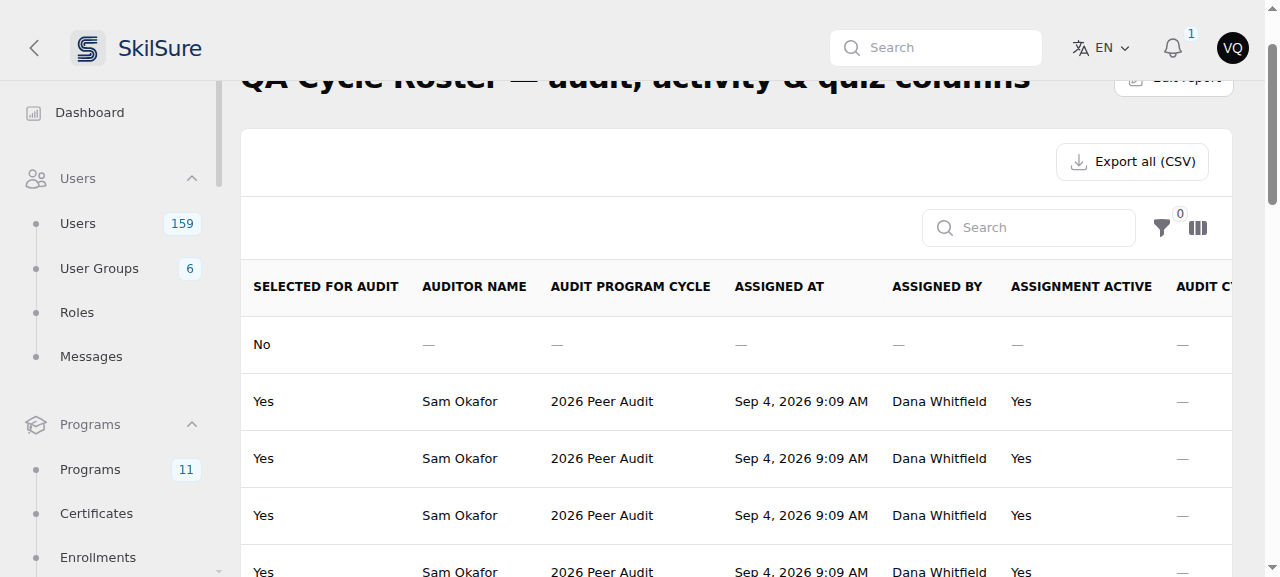 A roster with the audit columns in view. A member who isn't currently selected reads No, and the remaining audit columns are blank for them.
Adding audit columns to an existing report
Audit columns are added by an explicit action, never silently. Open the report and choose Add audit columns in the header — it appears only on a cycle roster whose cycle has audit assignments, only for admins with the audit-history permission, and only while the report doesn't already have them.
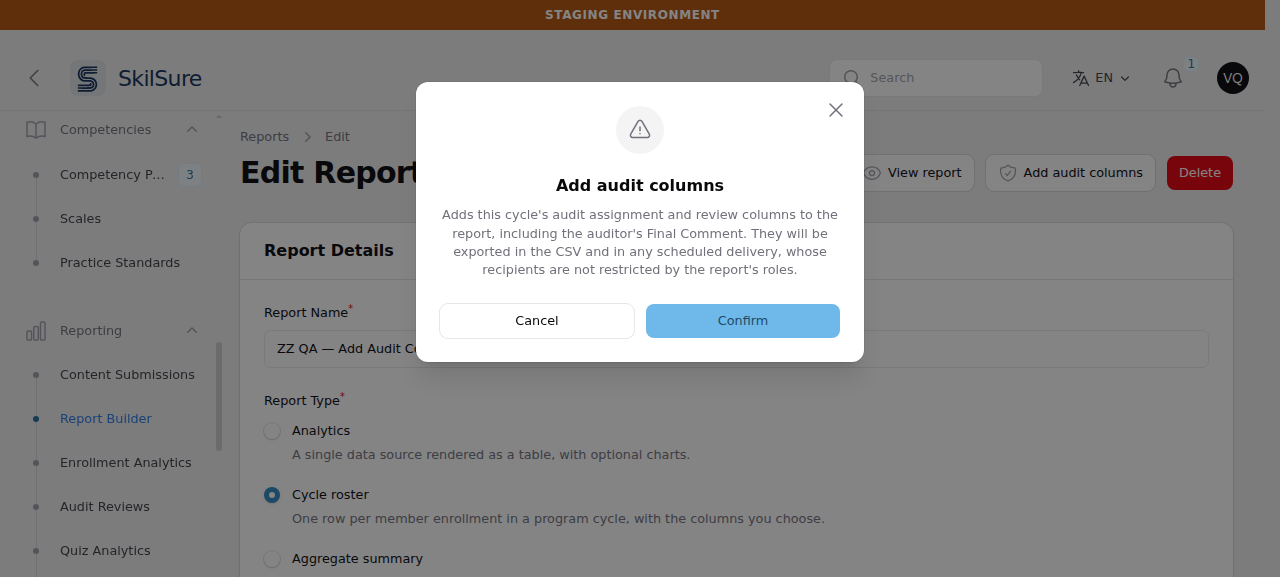 The action confirms before adding, because these columns carry the auditor's Final Comment into the CSV and any scheduled delivery.
Your existing columns, custom headers and ordering are kept — the audit columns are appended. Simply opening and saving a report never adds them, and neither does re-picking the same cycle.
CE Activities columns appear for a step with a Record of CE&PD (or similar activities content). They total each member's activities using the completion rules and table columns configured on that content — so an hours aggregate reports the member's total as 12h 30m, in the same format the activity table uses. Only submitted activities count; drafts and rejected entries are excluded.
Quiz columns appear for a step with a quiz, and report the highest attempt number that member reached on it.
Each of these carries the step name, so a program with the same content on several steps gets one clearly-labelled column per step rather than a single ambiguous one.
Viewing and exporting a roster
Open a saved roster (the View action on the list) to see one row per member enrollment in the cycle. The table behaves like the rest of the admin:
- Status columns (member status, enrollment status, step status) render as coloured badges; date columns are formatted for reading.
- Search filters the rows, the column picker toggles the non-default columns on, and filters narrow by status.
- Export all (CSV) exports every row; selecting rows enables Export selected (CSV). The CSV uses the same columns, order, and headers you configured.
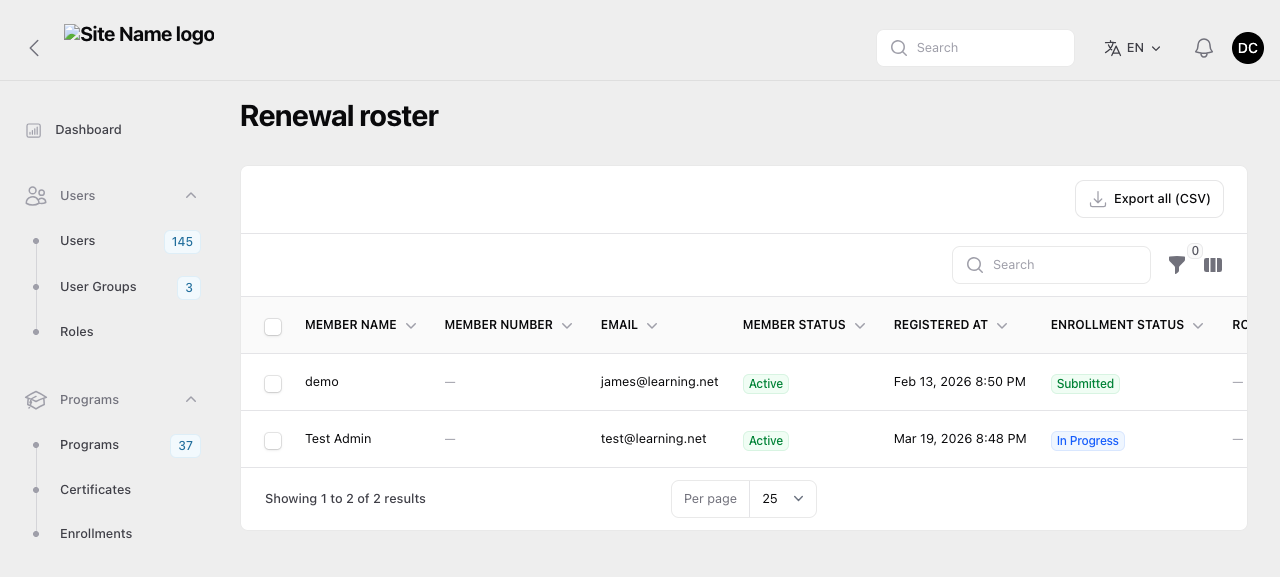 A cycle roster — one row per enrollment, with the columns and headers you configured. Status columns render as badges; export all or selected rows to CSV.
Exports are prepared in the background
Clicking any of the CSV buttons does not download the file straight away. SkilSure confirms that the export has started, builds it in the background, and then puts a notification in the bell menu with a Download CSV link.
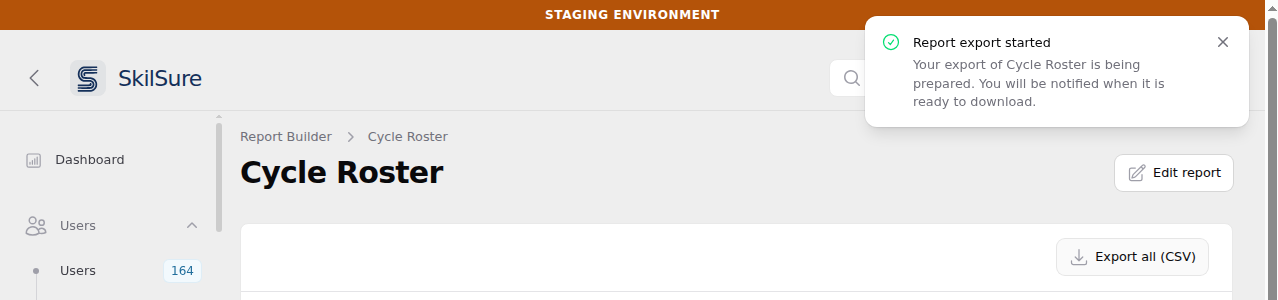 Clicking an export confirms straight away that it has started. The page stays usable while the file is built.
 When the file is ready, the bell menu carries the notification and the download link. The row count tells you what you're getting before you open it.
This is what makes the export work on a large cycle. Building the file in the browser request meant holding every row in memory at once, so on a roster of several thousand members the export could fail to produce a file at all. Preparing it in the background removes that ceiling — the size of the cycle no longer decides whether the export succeeds.
What this means day to day:
- You can leave the page. The export keeps building, and the notification is waiting in the bell menu when you come back.
- Small reports still finish in seconds. The notification usually appears almost immediately.
- Clicking again won't start a second copy. If you ask for the same export twice in quick succession, SkilSure tells you it's already being prepared rather than building it twice. This covers an accidental double-click, not a long wait — if a big export is still running a minute later, clicking again does start another one. Changing your row selection first does count as a different export.
- The download link is yours. Only the person who asked for the export can download it, even if someone else could view the same report.
- If it fails, you're told. A failed export sends a notification too, so a request never disappears silently — retry from the report page.
- The file reflects your own access — your roles, your groups, and whether you're permitted to see audit columns — because it is built as you, at the moment you asked for it.
Nothing changed about the file itself
The columns, their order, and the headers you configured are exactly as before, and identical to the CSV that scheduled delivery emails out.
Aggregate summaries
An aggregate summary rolls a form's answers up across the cycle's members — useful for feedback surveys and similar "how did everyone answer?" reporting.
- Set Report Type to Aggregate summary and anchor it to a Program and Cycle.
- Pick the target form / content whose answers you want to distribute.
- List the questions to summarise (the field key, a display label, and the answer options). Leave the options empty for open-text answers.
- Optionally set a group-by field key to split each distribution into groups (e.g. by competency or track).
Viewing the report shows each question's distribution — every option with its count and percentage of responses.
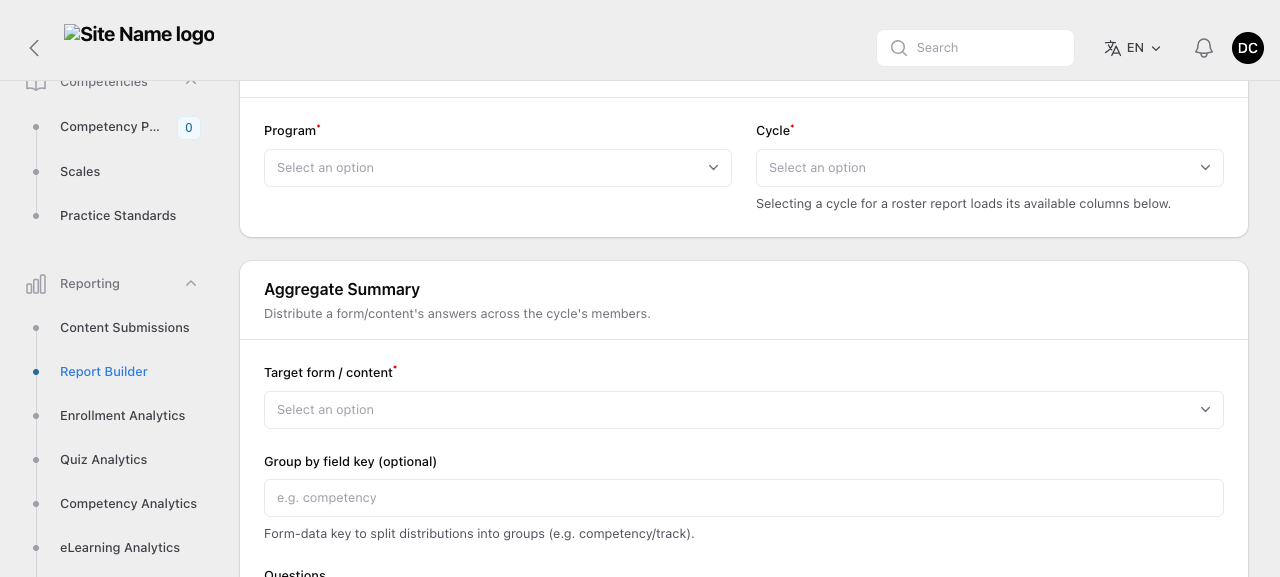 Aggregate summary configuration: anchor to a program and cycle, pick the target form, set an optional group-by, and list the questions to summarise.
Restricting, pinning, and scheduling
A cycle report carries a few extra options for operational use:
- Role restriction — limit who can see and export the report to specific roles. Leaving it unrestricted makes it available to any admin with report access; super admins always have access.
- Pin to navigation — pinned reports appear as quick links under the Reporting group, so frequently-used operational reports (renewal, reinstatement) are one click away.
- Scheduled delivery — have the report exported and emailed to named recipients on a cadence, so the people who need it don't have to open the admin at all.
For the original single-source analytics reports, gap analysis, and the completed-program export, see Reporting & analytics.