
Appearance
AdminReporting & analytics
The Reporting sidebar group is the data side of SkilSure. It splits into three jobs: review work (submissions queue), read dashboards (pre-built analytics), and build & export reports (custom reports, gap analysis, batch export).
Content Submissions — the review queue
Every piece of work a user submits lands here. It's where reviewers, mentors, and admins triage and approve.
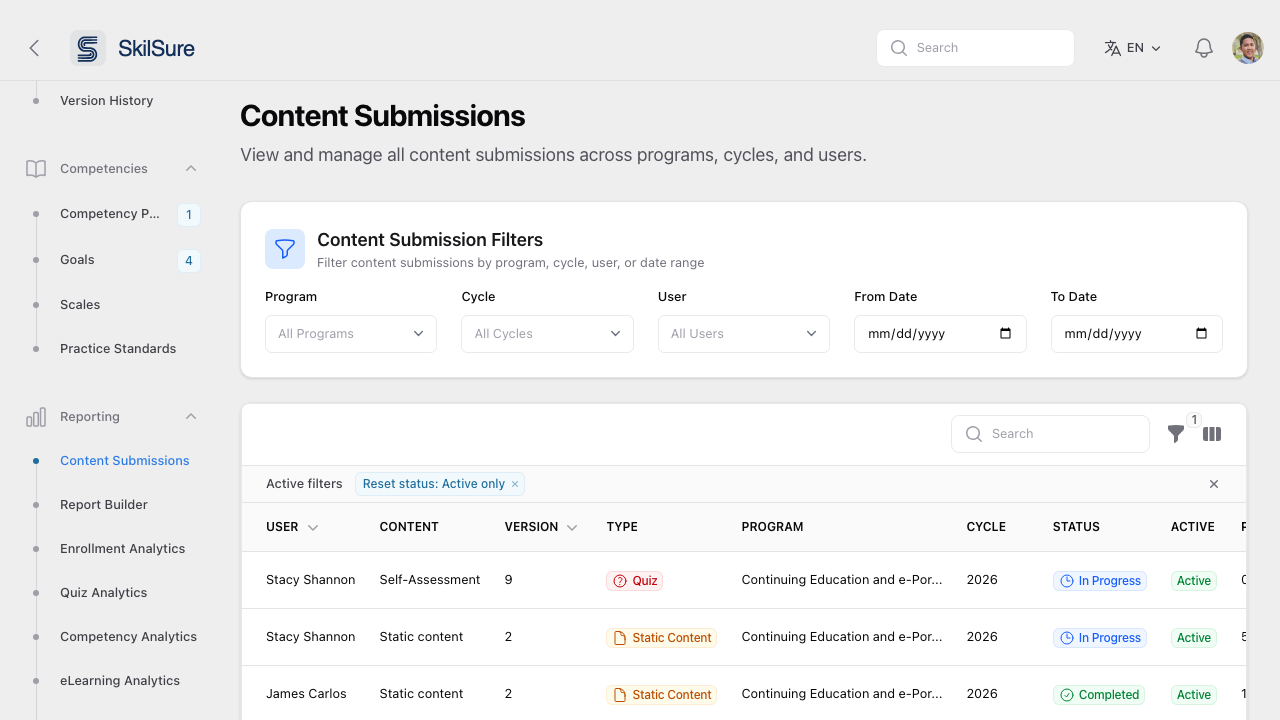 Content Submissions. Filter by program, cycle, user, or date range; status badges show what's In Progress, Submitted, or Completed.
- Filters at the top scope the table — useful when you only care about the current cycle.
- The table shows User, Content, Version, Type (Quiz, Static Content, Form, etc.), Program, Cycle, Status, and Active flag.
- Click a row to open the submission, review it, and approve, reject, or return it for revision.
Pre-built analytics dashboards
Five domain dashboards under Reporting give you ready-to-read views — no setup required.
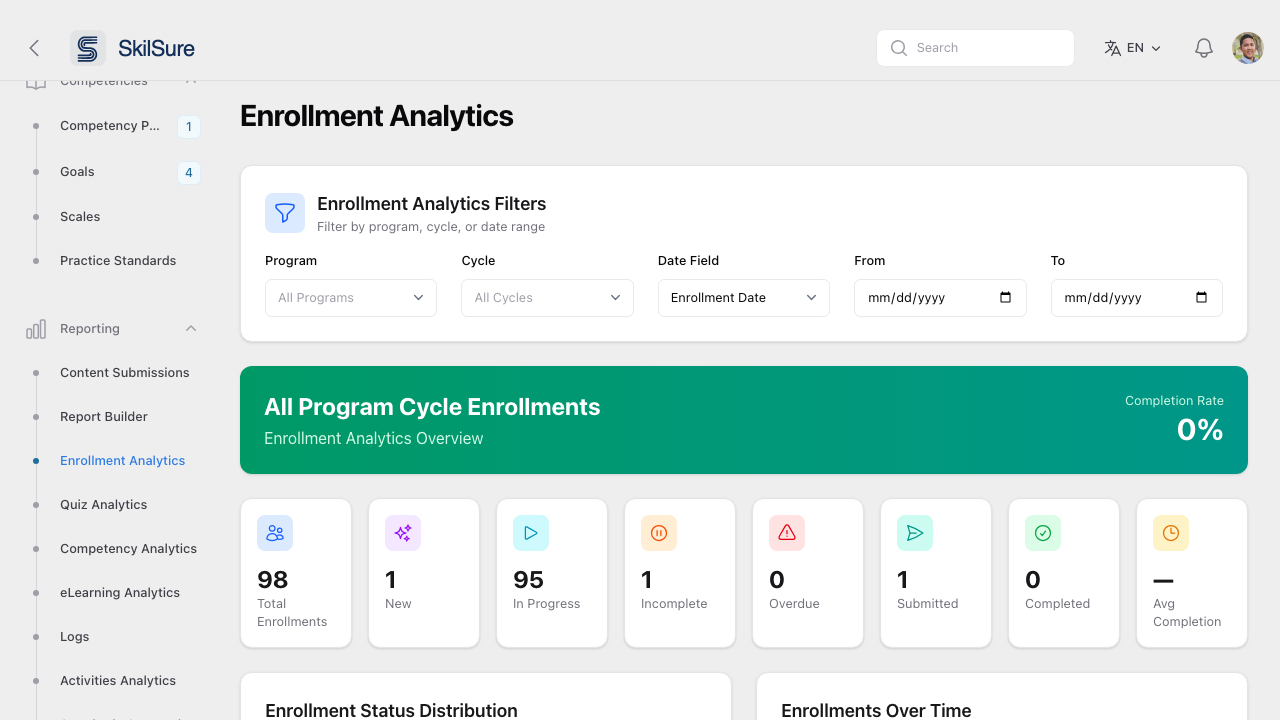 Enrollment Analytics — KPI tiles plus charts for status distribution and enrollments over time.
- Enrollment Analytics — totals, status mix (New / In Progress / Incomplete / Overdue / Submitted / Completed), completion rate, and enrollments over time.
- Quiz Analytics — attempt counts, pass rates, score distribution.
- Competency Analytics — how users are performing against the competencies the program maps to.
- eLearning Analytics — engagement with SCORM and other eLearning content.
- Activities Analytics — volume and approval status for Activity-type submissions (e.g. CPD activities).
All five share the same filter pattern at the top: Program, Cycle, and a date range. The Date Field selector on Enrollment Analytics lets you choose whether the date range applies to enrollment date, completion date, or deadline.
Activities Analytics
The Activities Analytics table lists every activity submission. Any custom columns configured on the activities content (see Configure an activities module) appear here too, and a Create Date column is available from the column manager (hidden by default).
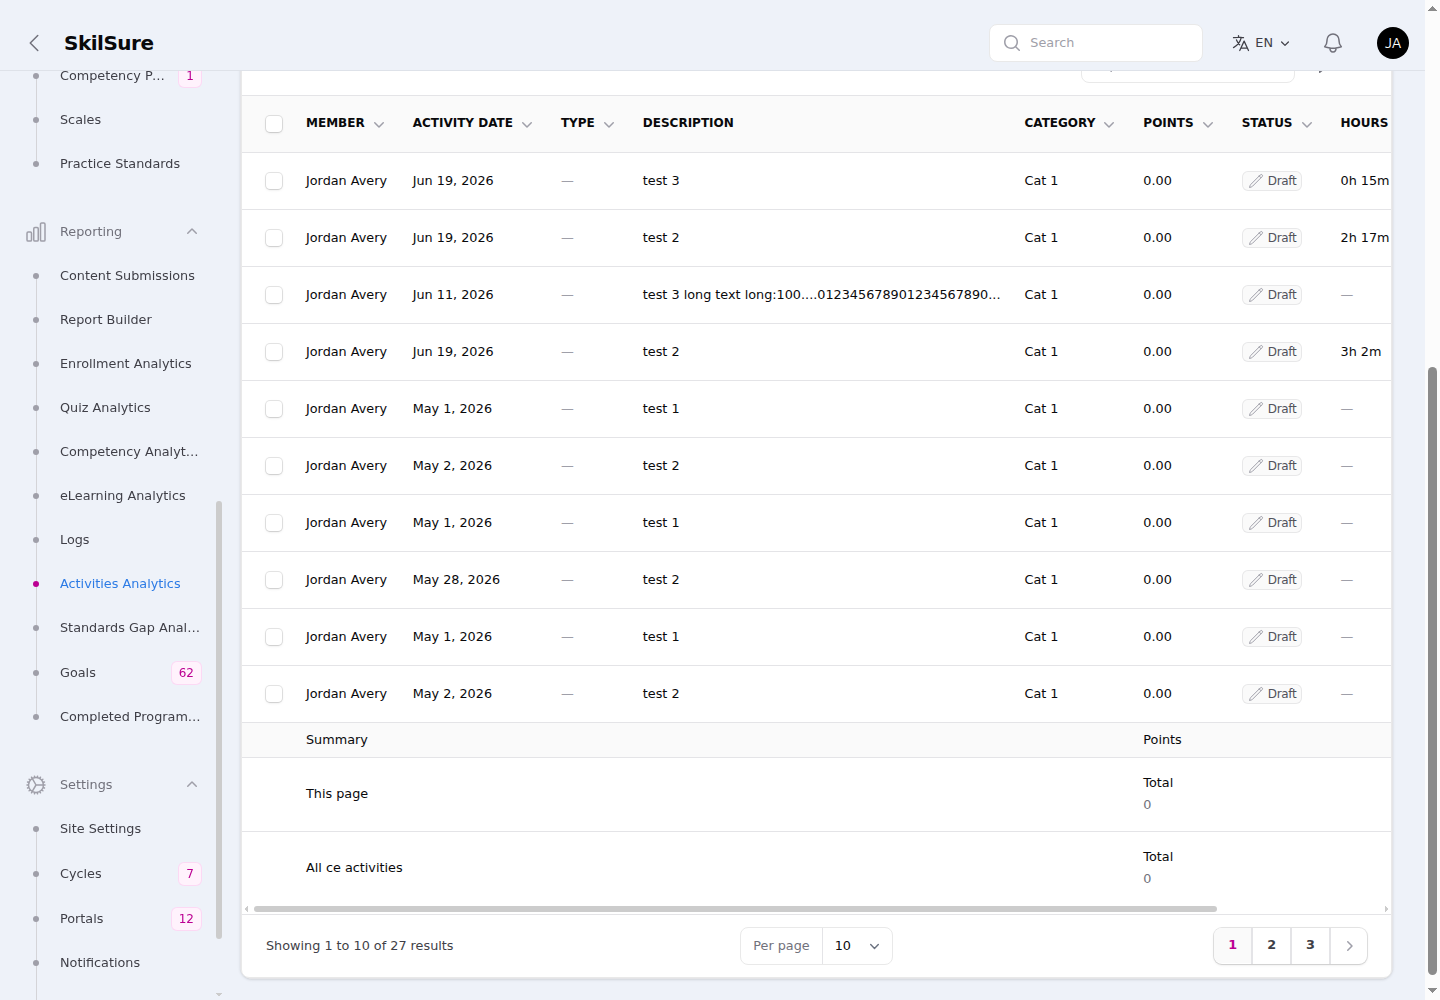 Activities Analytics. The Hours column here is a custom column defined on the activities content.
Click View on any row to open the activity — the same detail view the user sees, plus an admin-only Member line and (for reviewed activities) a Review History block.
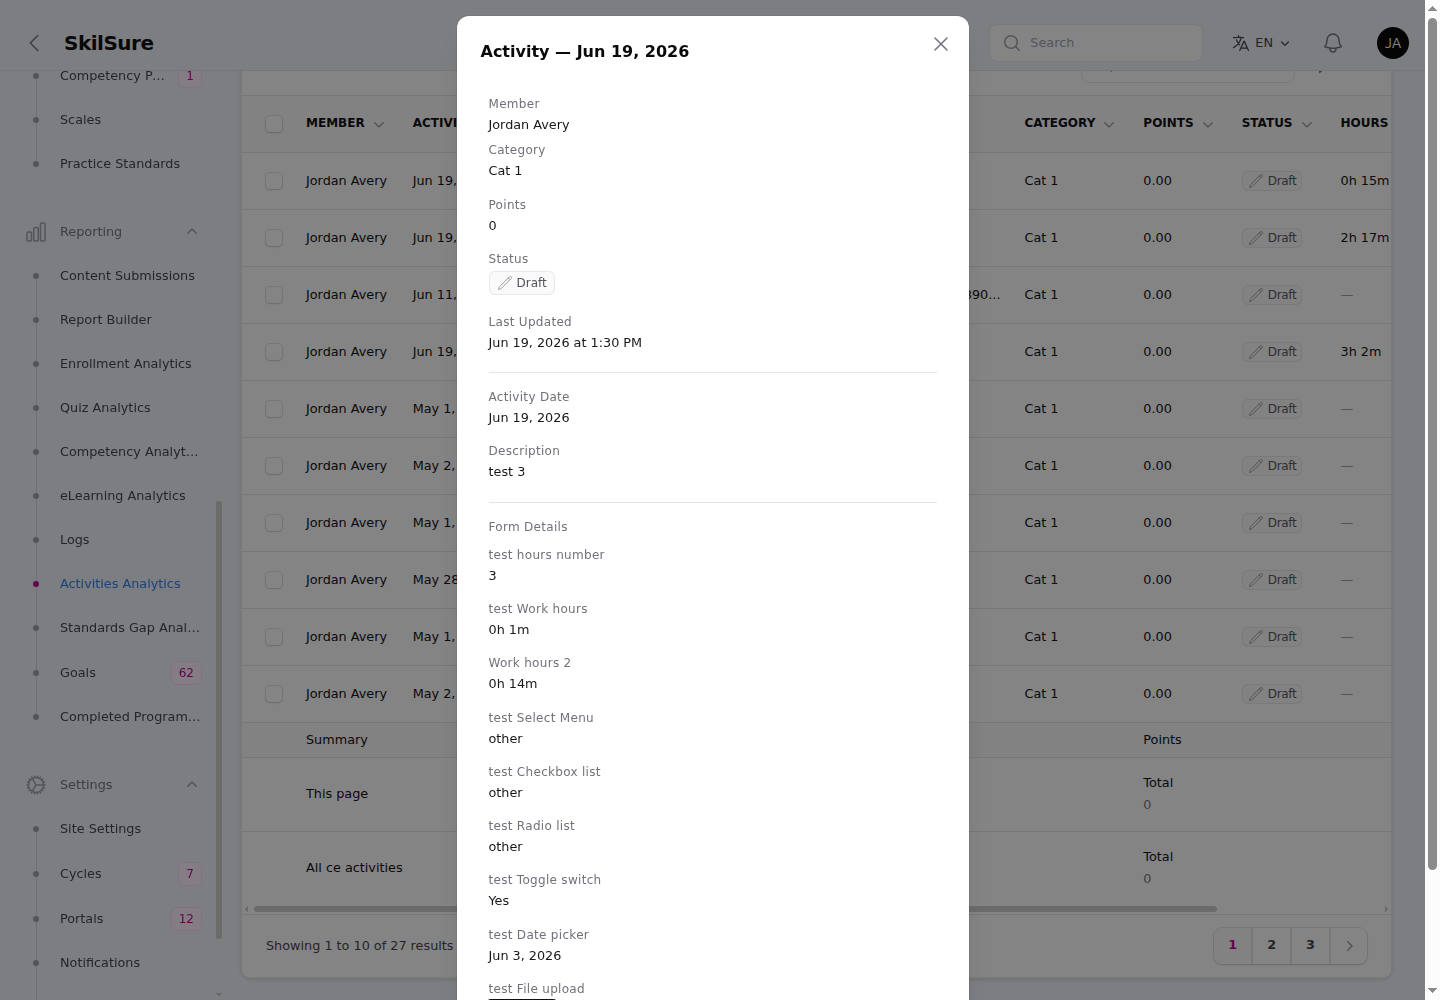 The View modal mirrors the user's activity view and adds the Member line for admins.
Report Builder — custom reports
When the pre-built dashboards aren't enough, build your own. Every report starts with a Report Type, chosen from a radio with a short description under each option:
- Analytics — a single data source rendered as a table, with optional charts (the classic builder, covered below).
- Cycle roster — one row per member enrollment in a program cycle.
- Aggregate summary — a cross-member distribution of a form's answers across the cycle.
Cycle reports
Cycle roster and Aggregate summary anchor to a program and cycle and discover their columns from it. See Cycle reports — rosters & aggregates for building, viewing, and scheduling those.
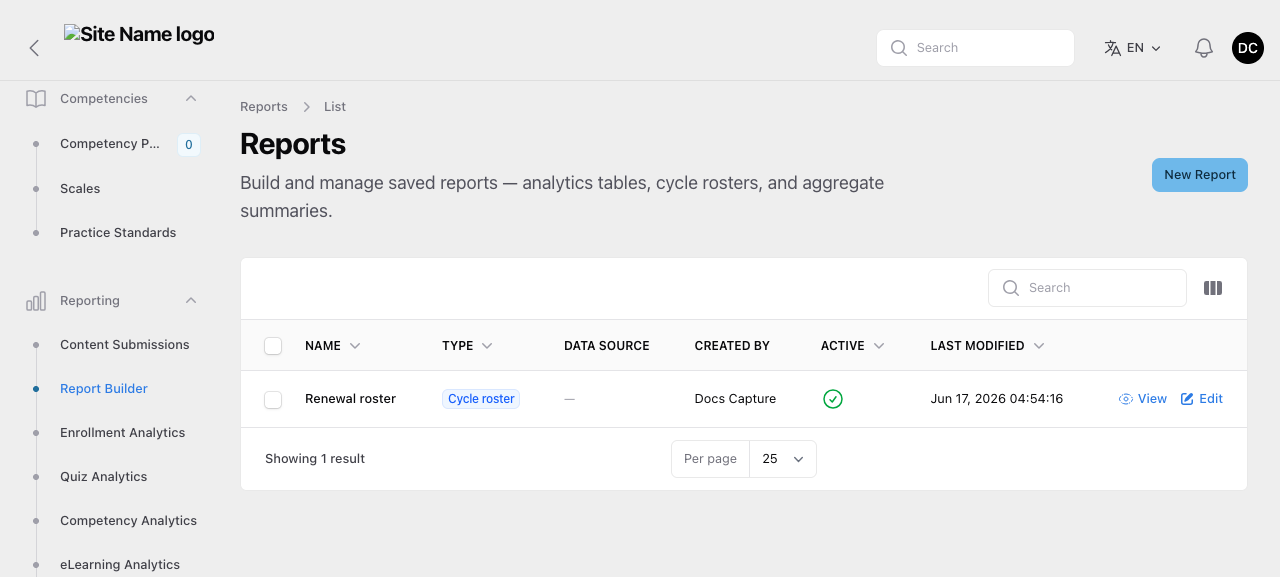 The Reports list. The Type column shows each report's shape; clicking a row opens it for viewing. Data Source applies only to Analytics reports.
Analytics reports
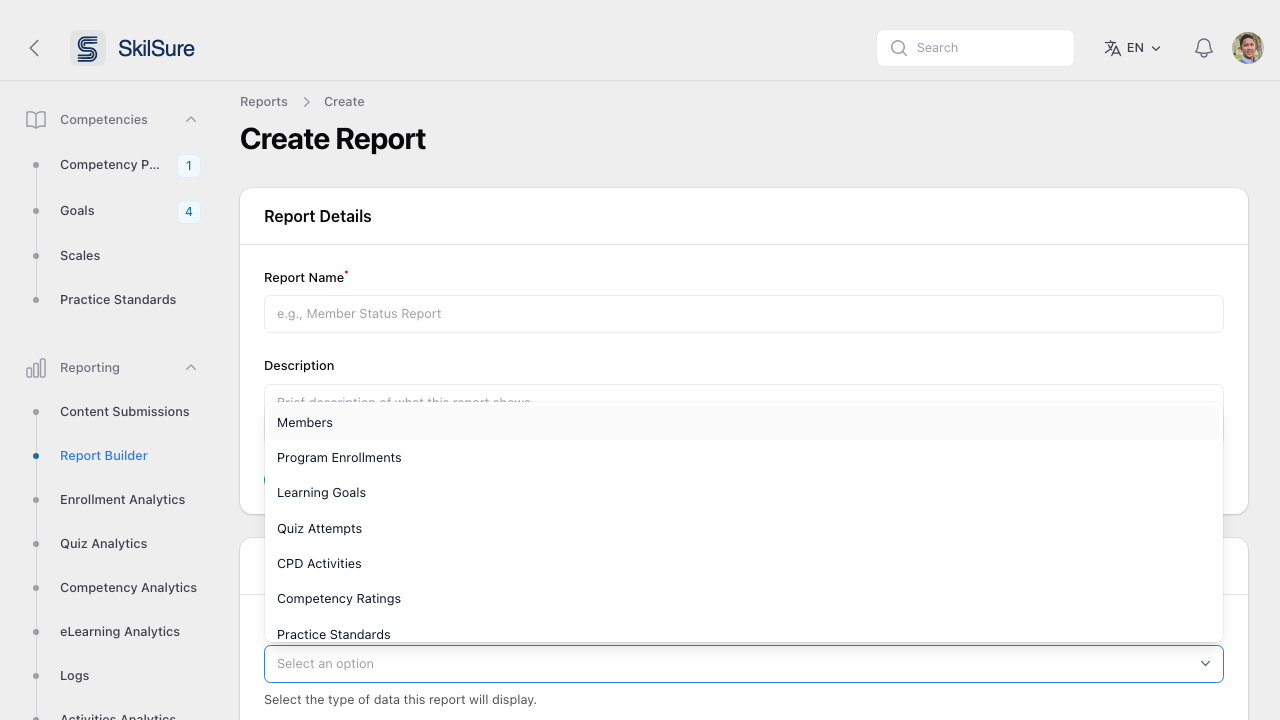 For an Analytics report, pick a Data Source — each brings its own column set.
The available data sources cover most reporting needs:
- Members — user records and profile data.
- Program Enrollments — every enrollment with its status and dates.
- Learning Goals — competency goals set by or for users.
- Quiz Attempts — individual attempts and scores.
- CPD Activities — continuing professional development activity submissions.
- Competency Ratings — competency scores from rating steps.
- Practice Standards — practice-standard data.
- Content Submissions — every submission record.
- Click New Report on the Reports list.
- Name the report and set Report Type to Analytics.
- Pick a Data Source and the columns to include.
- Save. The report is then available to view and export.
Standards Gap Analysis
A focused view that compares Practice Standards against what users have actually covered.
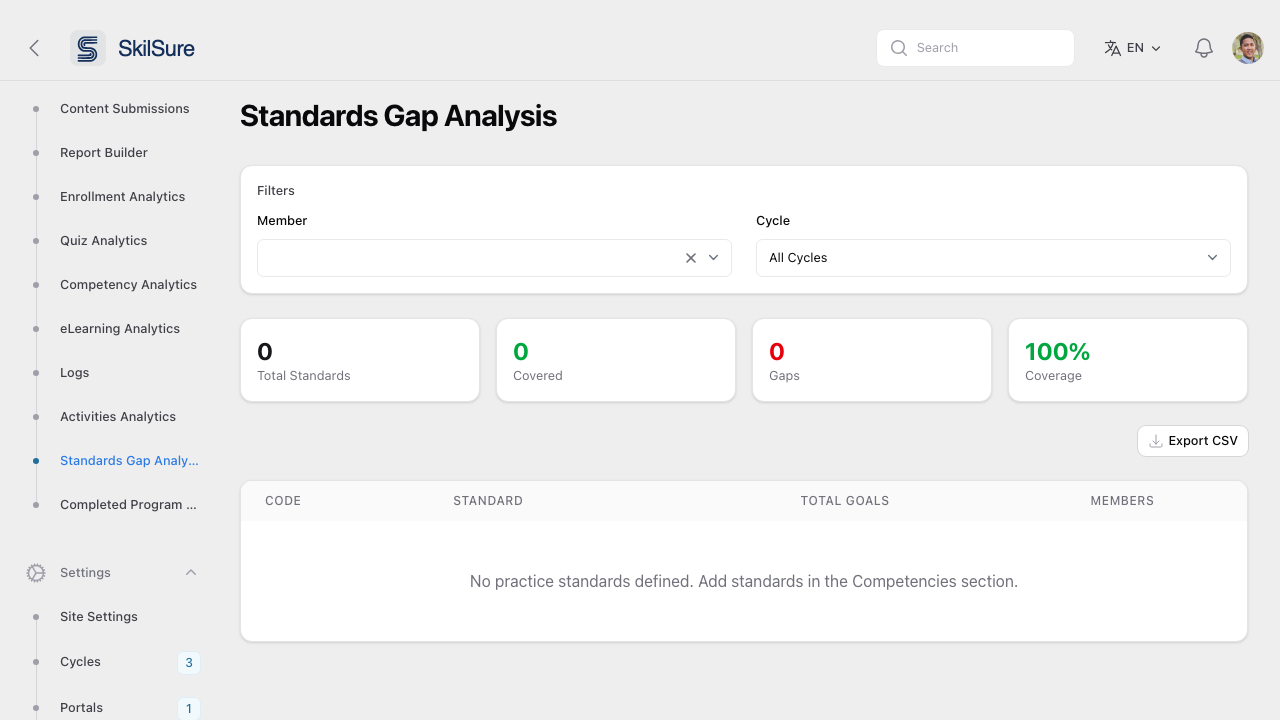 Standards Gap Analysis. Total Standards, Covered, Gaps, and Coverage % at the top; a per-standard breakdown below.
- Filter by Member and Cycle.
- The KPI strip shows total standards, how many are covered by the user's program activity, how many are gaps, and overall coverage.
- The table below itemises each standard with its code, total goals, and members it applies to.
- Export CSV for sharing or audit.
Prerequisite
This view depends on Practice Standards being defined under Competencies → Practice Standards. Without standards, the page shows zero coverage.
Logs
An audit trail across three log types — useful for support, security review, and onboarding troubleshooting.
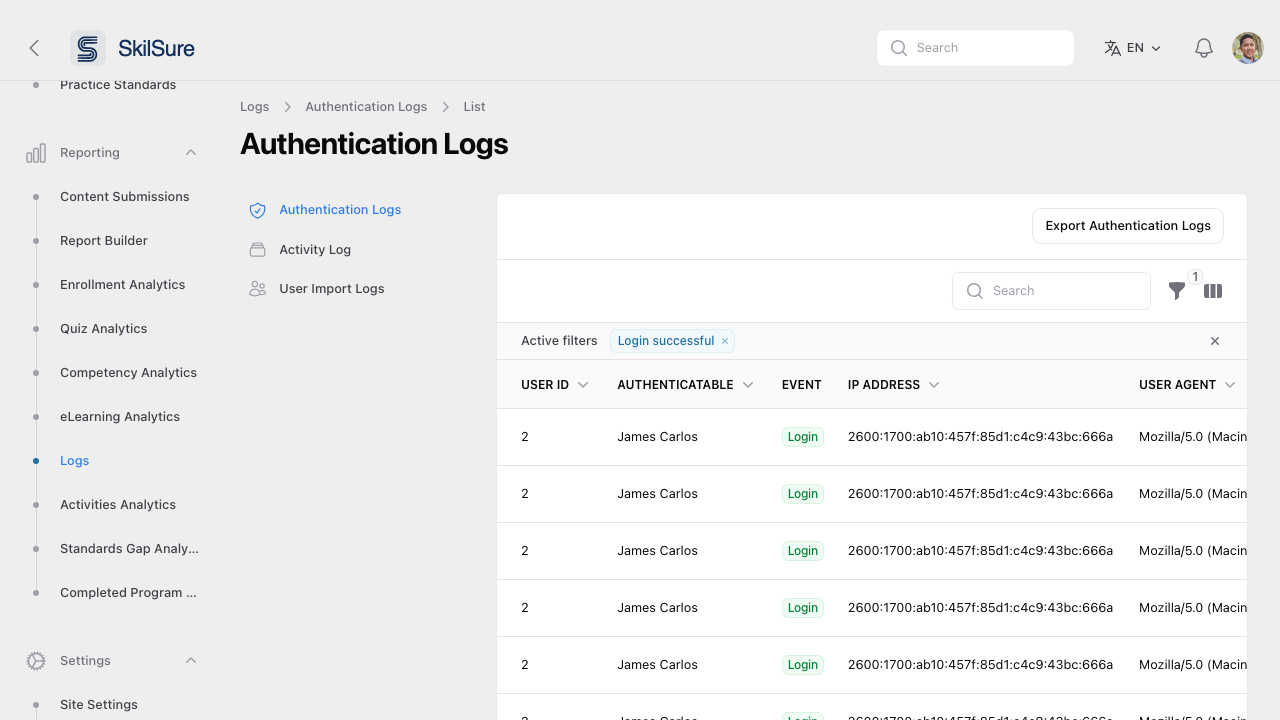 Logs → Authentication Logs. The left rail switches between Authentication, Activity, and User Import logs.
- Authentication Logs — every successful and failed sign-in, with user, IP, user agent, and event type.
- Activity Log — record of admin actions across the tenant.
- User Import Logs — outcomes of bulk user imports.
Completed Program Auto-selection & Export
Batch-pick a random or rule-based sample of completed enrollments and export them — typically used for compliance audits and randomised reviews.
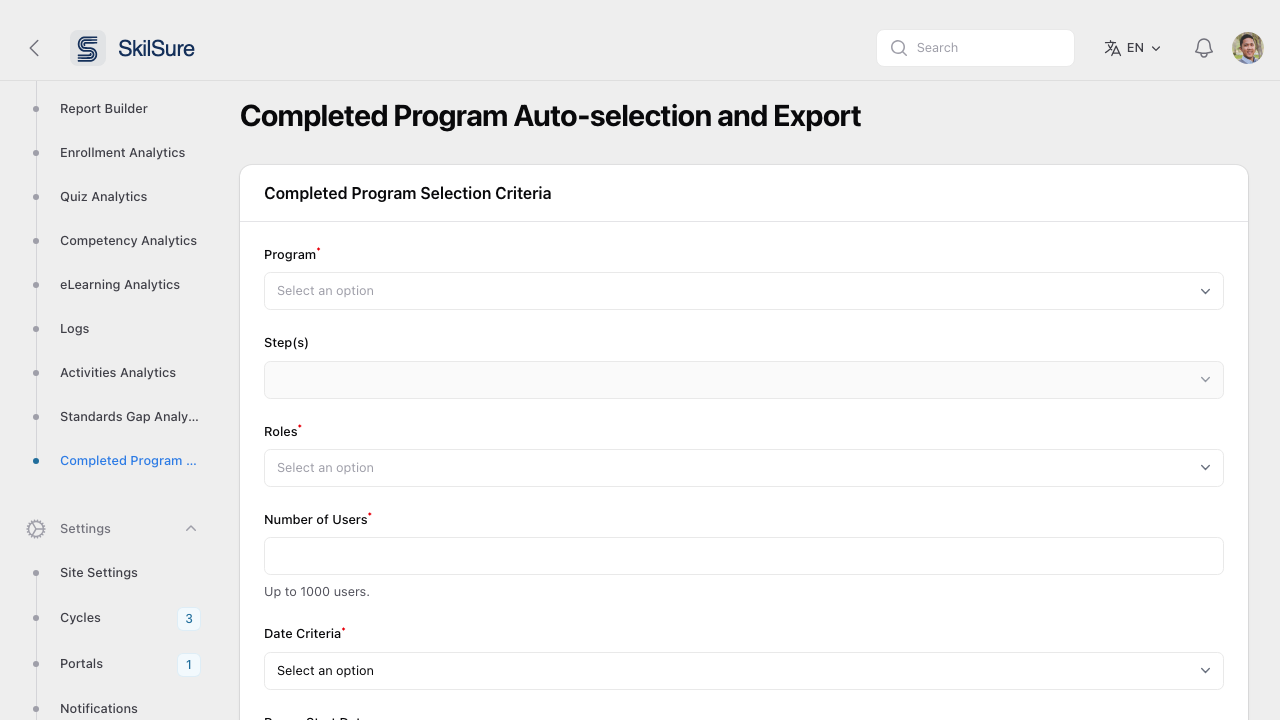 Completed Program Auto-selection. Define the selection criteria; SkilSure picks the matching set and exports it.
- Pick the Program and (optionally) specific Step(s) to scope the selection.
- Choose which Roles should be considered.
- Enter Number of Users (up to 1,000).
- Pick the Date Criteria — cycle start, cycle deadline, or enrollment completion — and a date range.
- Optionally toggle Skip in-progress content submissions to keep the export clean.
- Save the selection and trigger the export.
Manage your selections
Saved selections are listed below the form, each with View, Export, Download Export, and Delete actions.
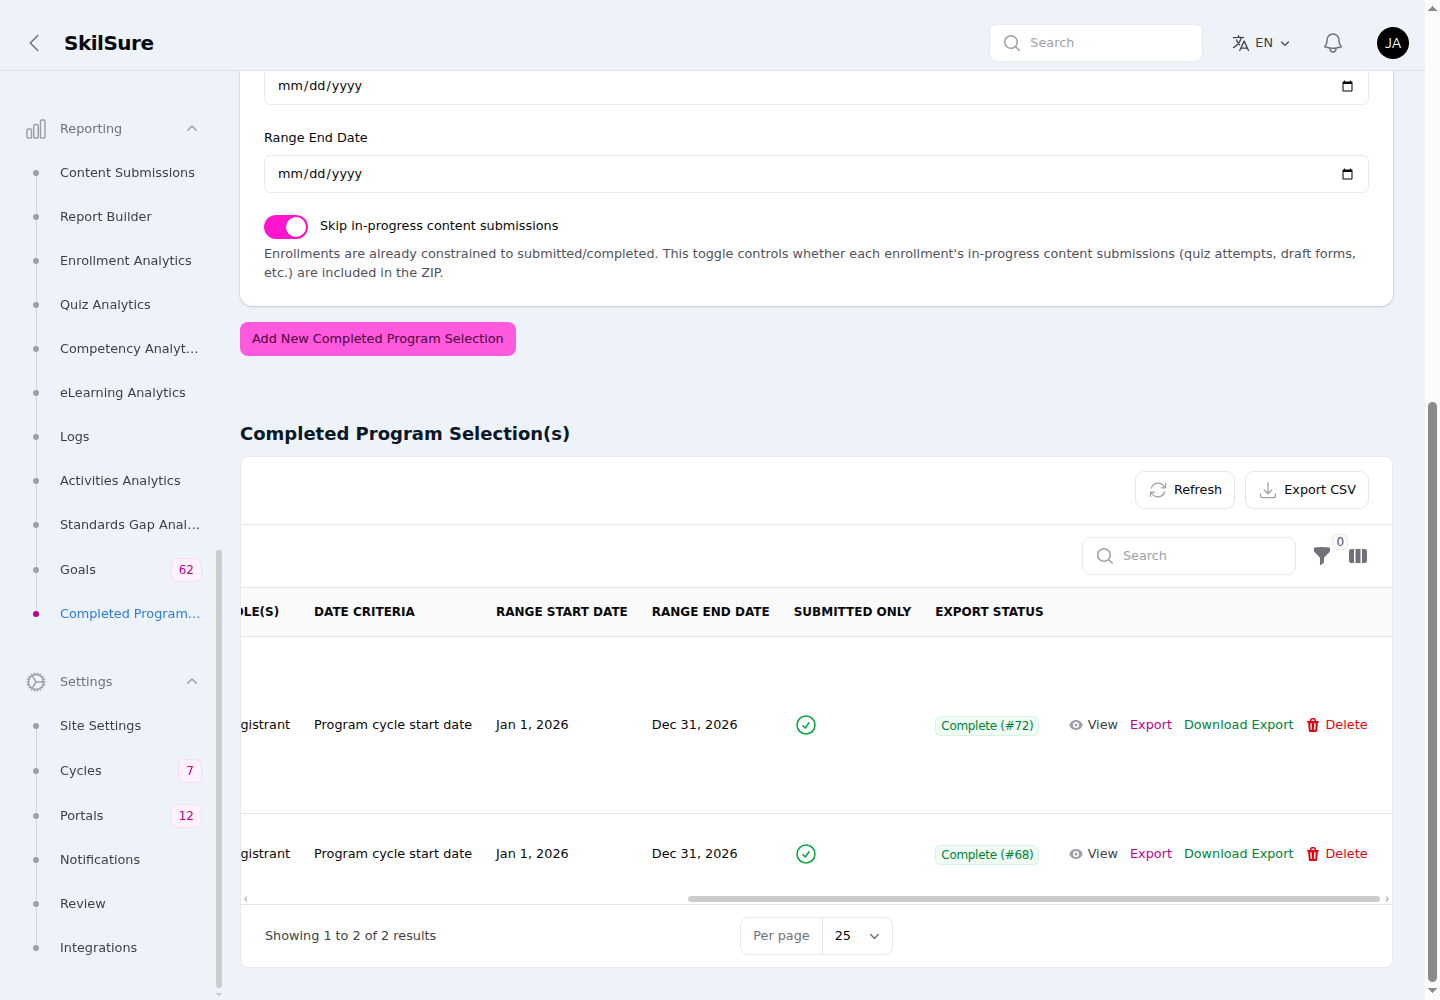 Completed Program Selection(s). Delete is always available — even while an export is still running.
- Delete is always shown and enabled, even when an export for that selection is still queued or running. Deleting cleans up the selection and any export files it produced.
- Exports of Learning Portfolio and Activities steps mirror what the user sees — the goal/activity tables (including custom columns) and the completion, form, and period rules — across the export PDF and CSV.