
Appearance
AdminMobile App Analytics
Reporting → Mobile App Analytics answers one question: how much is the mobile app actually being used? It counts sign-ins, app sessions and activity uploads, by month and by year.
It only appears if your organization has the mobile app integration switched on and configured.
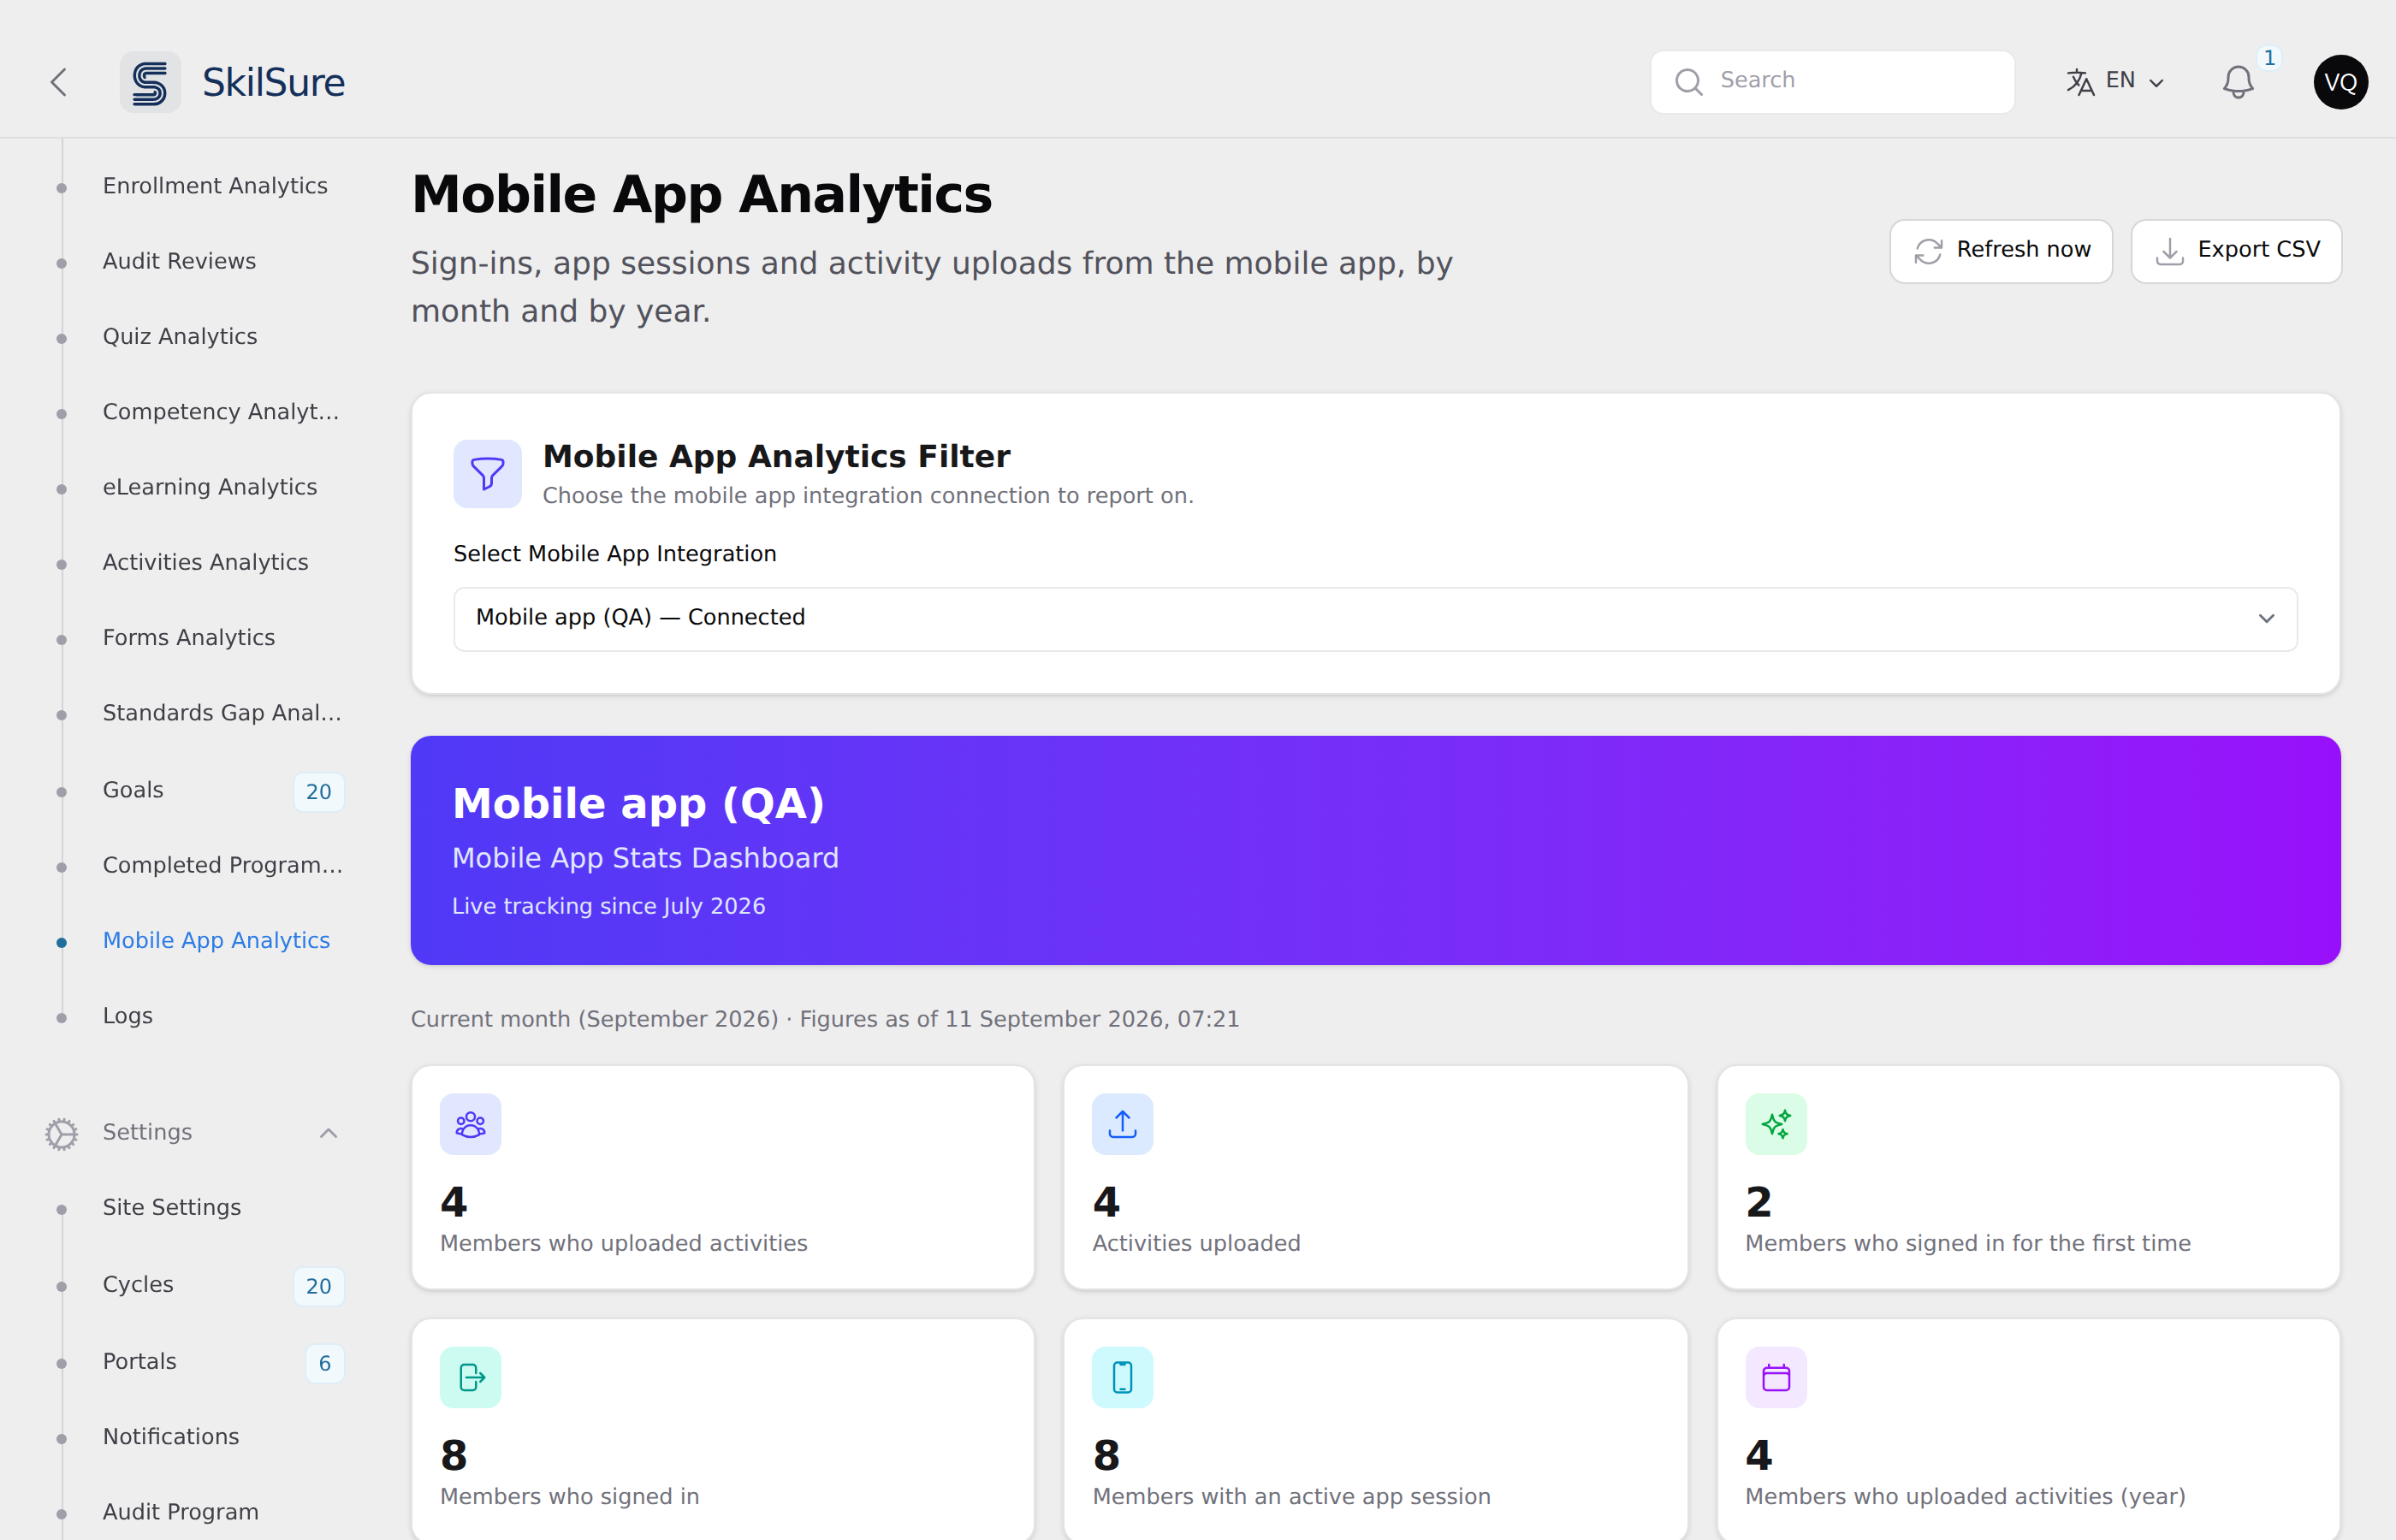 The filter, the dashboard header, and the current month's six figures.
Choose which integration to report on
Mobile App Analytics Filter picks the integration connection. Most organizations have one and it is selected for you; if you have several — a live one and a test one, say — choose which to read. The list shows each connection's status, so a disabled connection is recognizable.
A disabled connection still has history worth reading, so it stays selectable.
The seven figures
The dashboard shows the current month, plus the year-to-date upload figure:
- Members who uploaded activities — how many distinct members sent at least one activity from the app.
- Activities uploaded — how many activities they sent in total.
- Members who signed in for the first time — members whose first-ever app sign-in was this month.
- Members who signed in — distinct members who signed in at all.
- Members with an active app session — members whose app renewed its sign-in, whether or not they signed in fresh.
- Members who uploaded activities (year) — distinct members for the whole calendar year. This is its own count, not the sum of the monthly figures: a member who uploaded in March and again in July is one member, not two.
- Members who signed in for the first time (year) — distinct members whose first-ever app sign-in fell in that calendar year. Its own count, like the one above; a member appears in exactly one year.
Why the year figure is smaller than the months added together
Every figure here counts members, and the same member shows up in several months. Adding months together would count them repeatedly. The yearly row is counted separately for that reason.
Detail Stats
Below the dashboard, Month Stats and Yearly Stats give the full history rather than just the current month.
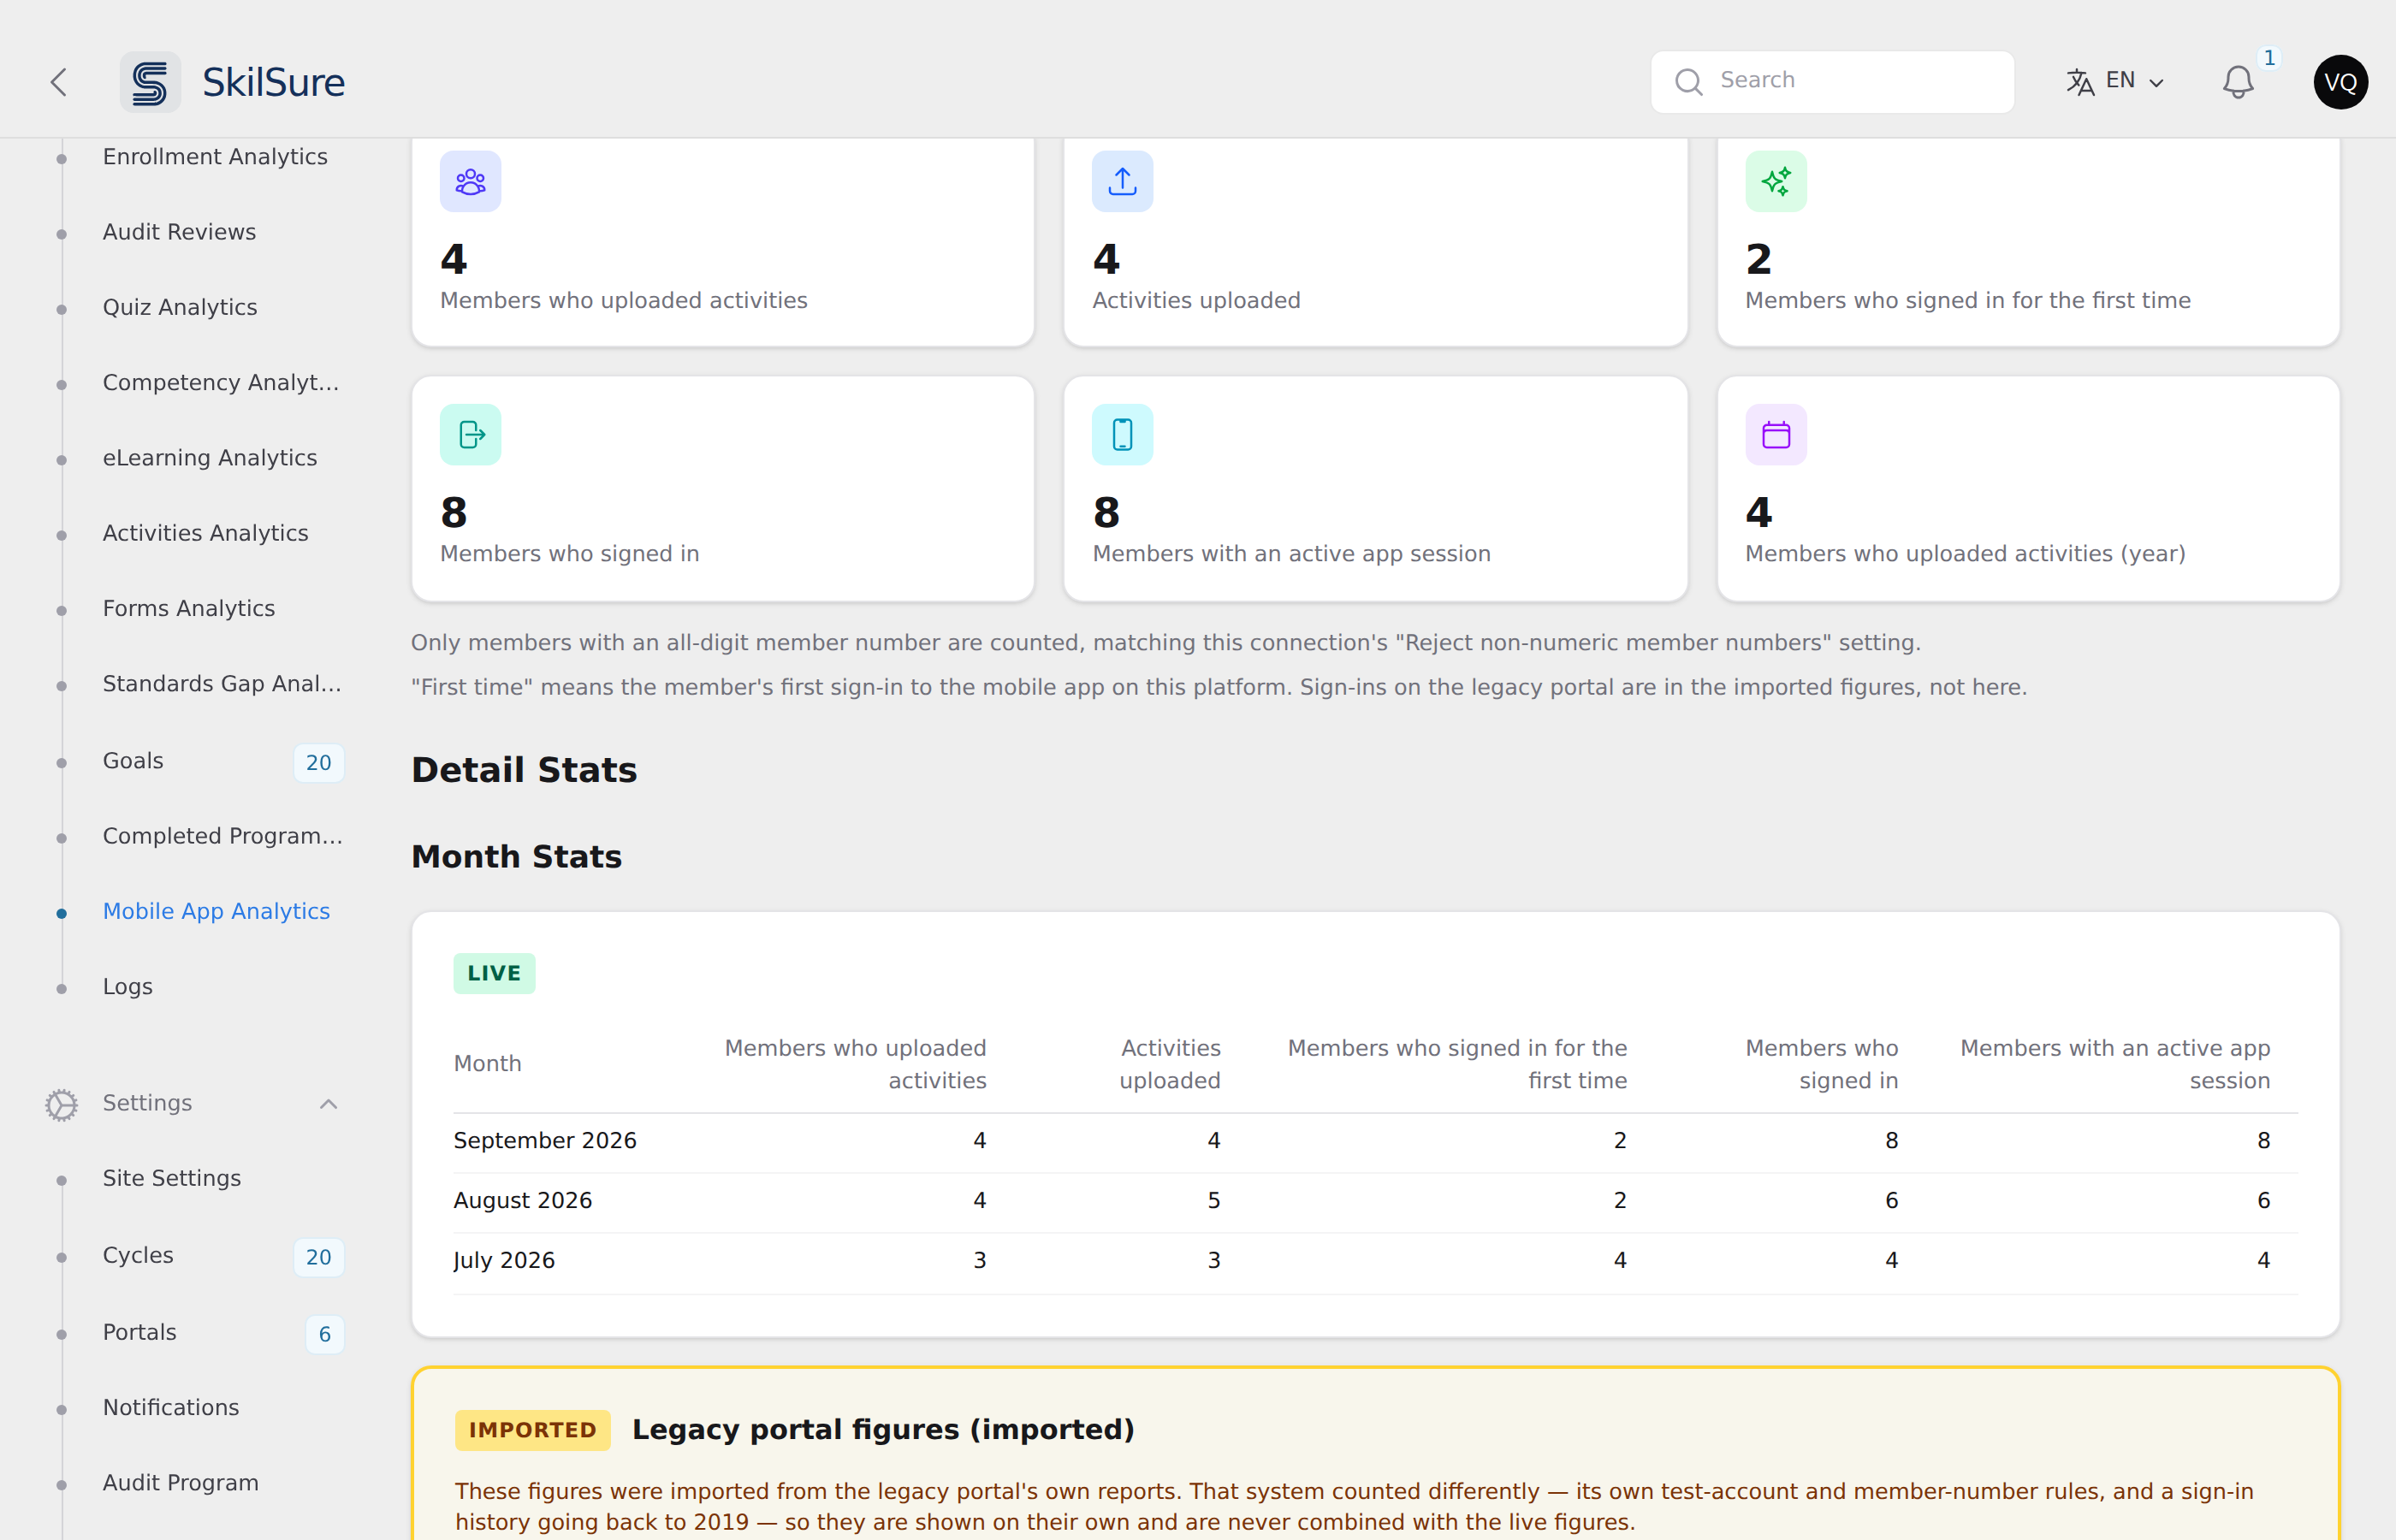 Live figures and imported legacy figures, in separate blocks.
Live and imported figures are kept apart
If your organization used a previous system, its historical figures can be imported so you keep continuity. Those rows are badged IMPORTED and sit in their own block.
They are never added to the live figures, and this is deliberate. The old system counted differently — its own test-account rules, its own member-number rules, and a sign-in history going back years. A single combined total would look authoritative while mixing numbers that were never measured the same way.
A dash is not a zero
Where a legacy cell shows —, that statistic simply was not being tracked at the time. It does not mean nobody did anything that month. A zero would be a claim the old data cannot support.
Who is counted
If the connection has Reject non-numeric member numbers switched on — the usual setting where applicants hold a prefixed number — only members with an all-digit member number are counted. The page states which rule is in force, directly under the figures.
The same rule decides where tracking starts: the Live tracking since month is the first month in which a counted member did something. If the setting was switched on later, activity by members it now excludes does not pull the starting month back — so you will not see a run of all-zero months in front of the real figures.
"First time" means a member's first-ever sign-in, on this platform or a previous system — once someone has imported the previous system's sign-in history for the connection. Until then it can only reflect sign-ins on this platform, so long-standing users count as first-timers here. The previous system's own figures remain in the imported block and are never combined with the live ones.
When figures update
Statistics are compiled overnight, so the page normally reflects the previous night's run. Refresh now recompiles immediately — useful if you have just been asked for a number. It is rate-limited to once every 30 seconds; if you click again too soon the page tells you it skipped rather than pretending it recomputed.
Export CSV downloads everything on the page in the same layout as the tables — statistics as rows, one column per month or year — with a Source column marking each row Live or Legacy (imported), so the two never blur together in a spreadsheet.
The first tracked month is partial
Uploads are only attributed to the mobile app from the day tracking began on this platform, so in that first month the upload figures cover part of the month while the sign-in figures cover all of it. The page flags this while that month is the one on screen.
If the page is empty
An empty page usually means statistics have not been compiled yet — use Refresh now. If figures stay at zero, check that the connection you selected is the one your members actually use, and that their member numbers match the rule above.